Business Statistics – Week #7 Assignment
Week 7 Assignment
Question 1
Assume you have noted the following prices for paperback books and the number
of pages that each book contains.
Develop a least-squares estimated regression line.
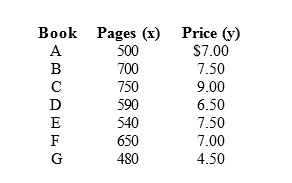
Compute the
coefficient of determination and explain its meaning.
Compute the
correlation coefficient between the price and the number of pages. Test to see
if x and y are related. Use α = 0.10.
Question 2
The following data
represent a company's yearly sales volume and its advertising expenditure over
a period of 8 years.
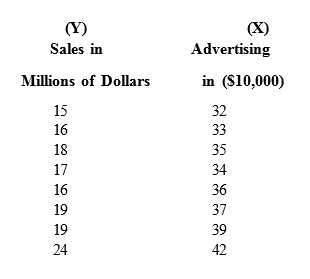
Develop a scatter
diagram of sales versus advertising and explain what it shows regarding the
relationship between sales and advertising.
Use the method of
least squares to compute an estimated regression line between sales and
advertising.
If the company's
advertising expenditure is $400,000, what are the predicted sales? Give the
answer in dollars.
What does the slope
of the estimated regression line indicate?