Fundamental Properties of AC Circuits & Lab – Week 1 Lab
Alternating Voltage and Current
1. Watch Week 1 Video Lectures: Introduction to Virtual Instruments from the weekly content and the Introduction to Virtual Breadboarding in MultiSIM.
a.
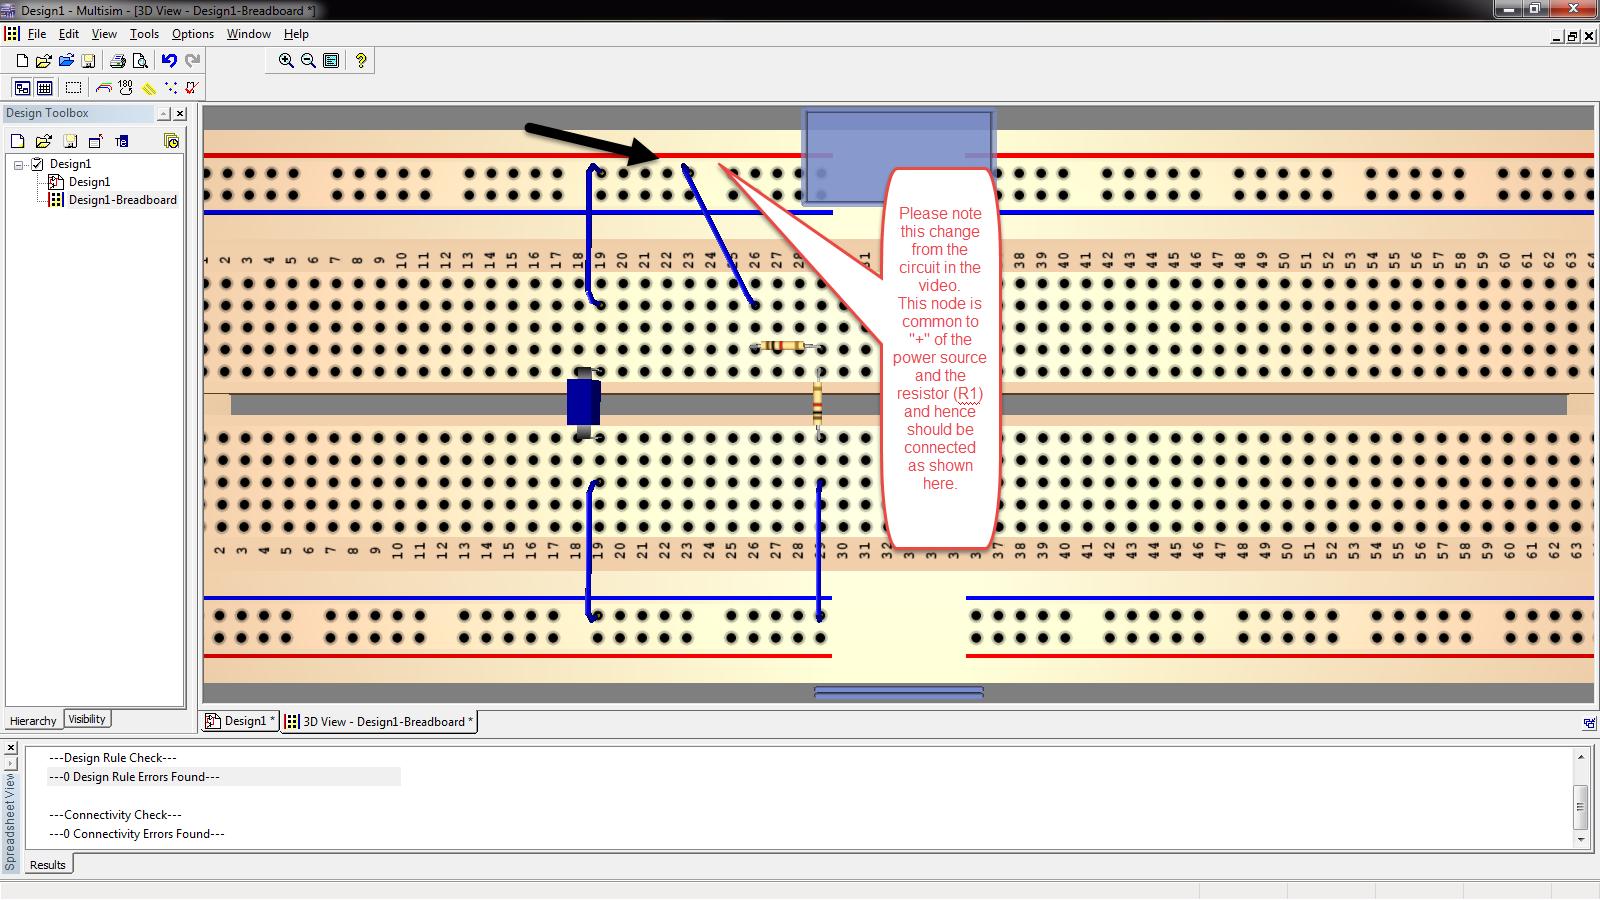
Please note that the virtual breadboard
circuitry in the "Week 1 Video Lecture 2 - Introduction to Virtual Breadboarding in MultiSIM"
is incorrect and should be modified. Check this document to correct the
circuitry in the video to run the DCR and Connectivity check: Modified Circuit Design
2.
For
problem 1 in the Week 1 Assignment, fill in the Calculated
column using 3 Vrms at 60 Hz
as your source. All calculations and measurements should
be done for RMS only. Make sure that you show
your work as required. Now construct the circuit. Use
the Agilent function generator for
the source.
3.
Using
the Agilent multimeter, measure the voltages
across the source and each resistor and fill out the chart below. Do not forget
to put units on the chart. Be sure to provide a screenshot showing the measurement of VR1 with
the connections to the Agilent function
generator and Agilent multimeter clearly
visible. INCLUDE THE TIME STAMP
SHOWN IN MULTISIM IN ALL SCREENSHOTS FOR THIS COURSE. (Not
including the time stamp can result in a grade of 1.) Also, use the multimeter to measure IT and RT (hint: remove the voltage
source to measure RT). Provide a screenshot of
each of these measurements.
|
|
Calculated |
Agilent Multimeter |
Tektronix Oscilloscope |
|
VT = |
|
|
|
|
VR1 = |
|
|
|
|
VR2 = |
|
|
|
|
VR3 = |
|
|
|
|
IT = |
|
|
N/A |
|
RT = |
|
|
N/A |
4.
Now
repeat the measurements using the Tektronix
oscilloscope and fill out the chart above (IT and RT are not
required). An oscilloscope is designed primarily for voltage, frequency, and
period measurements. Current can be measured with a special probe called
a current probe (which can be found in Multisim). Resistance cannot be
measured with an oscilloscope. (For the Tektronix Oscope, look for Cyc RMS). Provide
a screenshot of
at least one voltage measurement using the scope. Note what is required in
order to duplicate the Agilent multimeter measurement.
5.
Show
the calculated and measured period of the signal from the Tektronics Oscilloscope.
(Don't forget to click through the menu button on the scope.)
Provide a screenshot of the measurement.
|
Calculated period: (source frequency 60 Hz) |
Measured period: |
|
|
|
6.
Now change the values of R1 given below in the
table and use Tektronix oscilloscope to record the RMS Voltage measurement
across each resistor. Do not forget to add units in the chart. Take screenshots to
show your work for the period measurement as well for at least one case of R1.
The screenshots should
show the settings of the Agilent signal
generator and o-scope along with the waveforms.
7.
Complete the following chart:
|
|
|
|
Source frequency 60Hz |
Tektronix Oscope Measurement |
|
R1 = 5 kohms |
VR1 = |
|
|
VR2 = |
|
|
VR3 = |
|
R1 = 10 kohms |
VR1 = |
|
|
VR2 = |
|
|
VR3 = |
|
R1 = 15 kohms |
VR1 = |
|
|
VR2 = |
|
|
VR3 = |
|
R1 = 25 kohms |
VR1 = |
|
|
VR2 = |
|
|
VR3 = |
|
Source frequency 100Hz |
Tektronix Oscope Measurement |
|
R1 = 25 kohms |
VR1 = |
|
Source frequency 200Hz |
Tektronix Oscope Measurement |
|
R1 = 25 kohms |
VR1 = |
8. Based on your measurements, answer the following questions:
a. Did your calculated and measured values match? If not, why?
b. Does the multimeter give you the peak, peak-to-peak, or rms measurement?
c. How did you obtain the same measurement on the Tektronix oscilloscope that you obtained using the Agilent multimeter?
d. What is the industry practice to report AC measurements? Peak value or RMS value?
e. Describe the effect of increasing R1 on the total resistance of the circuit.
f. Describe and explain the effect of RT on the value of IT for a given value of VT.
g.
Does resistance depend on frequency? For a purely
resistive circuit, does the voltage or current change as the frequency changes?
Lab Template -
This lab template should be used in reporting your lab reports in all of your
labs.
Create your lab report and
submit as ET115W1LabYourGID.docx,
or an equivalent word processing file extension.
Rules for lab submissions:
1.
The lab document must
be a Word document. PDF files are NOT accepted.
2.
All screenshots must
be included.
3.
All Multisim
screenshots must include the date/time stamp. See TOOLS AND
TEMPLATES for the procedure to display the date and time.
4.
Any and all Multisim
files must be submitted.
5.
Any equations used
must be typed in Word. Copy and paste of equations from outside sources is
prohibited.
6.
No graphics are
allowed in the Word document other than screenshots of circuits from Multisim
and hardware if applicable, with the date/time stamp.
7.
The lab template
should be used. Specifically, it is brought to your attention that a
summary MUST be provided explaining the results of the labs, the relationship
of the results to expected results, and any challenges encountered.
8.
Hardware portion of
labs should include screenshots of the assembled circuit with your name and
student GID number written on paper next to the circuit. There should be
screenshots of the instrument readings with the date and time stamp on lower right
corner clearly shown. See example below.
Any violation of the
submission rules above will result in a grade of 1.